Your friend wants to visit you, but does not know how to get to your house. You want to help her find it. You could tell her your street address, but that wouldn’t help if she didn’t know where the street was. You might give her a picture of your house. That would tell her what your house looked like, but it wouldn’t show her how to find it. Well, how can you help her? You could draw a map!
It’s the job of a mapmaker, or cartographer, to put all of this information into a format that people can understand and learn from. Exactly what a person can learn depends on the type of map. Most maps start with an outline of a location, like a piece of land or a body of water. Then, they provide information about the location’s attributes. Different maps incorporate different attributes. For example:
Physical maps illustrate landforms like mountains, deserts and lakes. With a physical map, you can get a basic sense of what all or part of the planet looks like and what its physical features are. Physical maps usually show differences in elevation through hypsometric tints, or variations in color. Topographic maps, on the other hand, illustrate the land’s shape and elevation using contour lines.
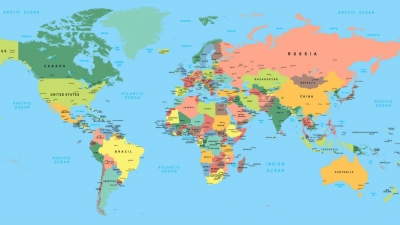
Political maps display cultural information about countries, their borders and their major cities. Most political maps also include some physical features, like oceans, rivers and large lakes. You can check out political maps of the world at our interactive atlas.
Thematic maps add information on a specific theme, or subject. Examples of common themes are population density, land use, natural resources, gross domestic product (GDP) and climate. Thematic maps can also show extremely specialized information, such as the availability of internet access in different parts of the world.
Picture Credit : Google